Citi Bike Analysis, April 2018 - March 2019
Introduction
From April 2018 through March 2019 there were 18,616,865 recorded Citi Bike trips. This analysis aims to break down the ridership demographics, to show which stations are more heavily used and why, and to give an overview of bike use.
Data
CSVs were downloaded directly from Citi Bike’s repository. Each CSV contained a record for every trip taken with Citi Bike for the specified month. Each record has an origin station, destination station, id of the bike that was used, duration, usertype, age, and gender. This does not cover individual users, only each trip.
The entire year’s worth of data had more records than Tableau could handle, so transformation was done to get monthly aggregates for each bike station and each birth year of the users to enable visualization of the entire year. Some figures below utilize the raw data of the last six months.
Analysis
Peak Hours
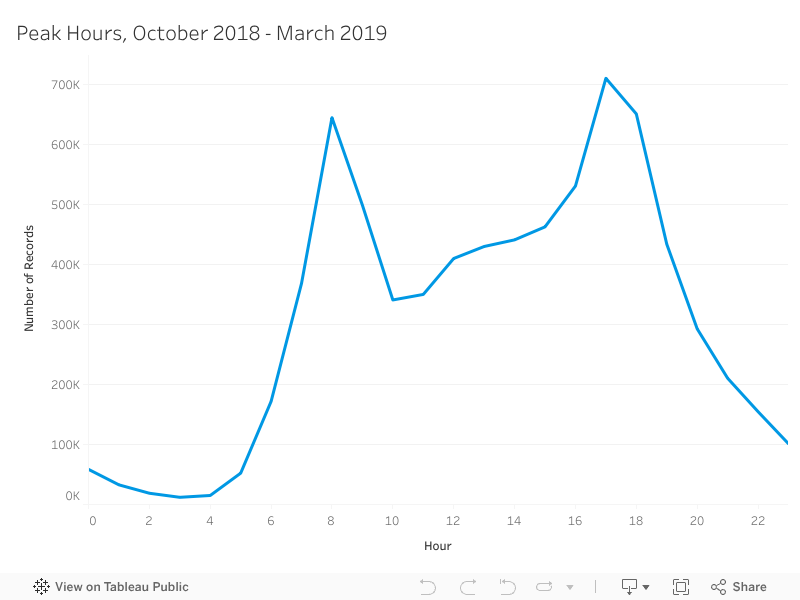
Naturally, peak usage hours are at 8:00AM and 5:00PM for rush the rush hours. The figure below displays the cumulative records of the last six months, but the distribution is virtually identical for any given month or set of months.
Station Use
The most popular stations for beginning and ending a trip are largely the same, as are the least popular stations.
| Origin Stations | Uses | Latitude | Longitude |
|---|---|---|---|
| Most Popular | |||
| Pershing Square North | 150,869 | 40.752 | -73.9777 |
| E17 St & Broadway | 112,425 | 40.737 | -73.9901 |
| W 21 St & 6 Ave | 110,839 | 40.742 | -73.9942 |
| Broadway & E 22 St | 108,667 | 40.740 | -73.9896 |
| Broadway & E 14 St | 96,829 | 40.735 | -73.9907 |
| West St & Chambers St | 96,359 | 40.718 | -74.0132 |
| West 41 St & 8 Ave | 90,127 | 40.756 | -73.9900 |
| Broadway & W 60 St | 87,841 | 40.769 | -73.9819 |
| 8 Ave & W 33 St | 87,510 | 40.752 | -73.9939 |
| Lafayette St & E 8 St | 85,969 | 40.730 | -73.9910 |
| Least Popular | |||
| MLK Light Rail | 11 | 40.711 | -74.0789 |
| Handlebar @ Gowanus | 11 | 40.670 | -73.9950 |
| NYCBS Depot - Delancey | 8 | 40.716 | -73.9823 |
| NJCU | 7 | 40.710 | -74.0858 |
| Danforth Light Rail | 6 | 40.693 | -74.0880 |
| 58th St Depot | 6 | 40.717 | -73.9838 |
| Columbia Park | 3 | 40.697 | -74.0969 |
| 8D OPS 01 | 3 | 40.663 | -73.9997 |
| GOW Tech Shop | 2 | 40.670 | -73.9950 |
| 8D QC Station 01 | 2 | 45.506 | -73.5695 |
| Destination Stations | Uses | Latitude | Longitude |
|---|---|---|---|
| Most Popular | |||
| Pershing Square North | 150,772 | 40.752 | -73.9777 |
| E17 St & Broadway | 115,735 | 40.737 | -73.9901 |
| Broadway & E 22 St | 113,627 | 40.740 | -73.9896 |
| W 21 St & 6 Ave | 112,057 | 40.742 | -73.9942 |
| W St & Chambers St | 101,603 | 40.718 | -74.0132 |
| Broadway & E 14 St | 97,112 | 40.735 | -73.9907 |
| W 41 St & 8 Ave | 90,353 | 40.756 | -73.9900 |
| 8 Ave & W 33 St | 87,458 | 40.752 | -73.9939 |
| Lafayette St & E 8 St | 87,250 | 40.730 | -73.9910 |
| 12 Ave & W 40 St | 87,033 | 40.761 | -74.0028 |
| Least Popular | |||
| MLK Light Rail | 9 | 40.711 | -74.0789 |
| Danforth Light Rail | 7 | 40.693 | -74.0880 |
| 58th St Depot | 4 | 40.717 | -73.9838 |
| 8D QC Station 01 | 3 | 45.506 | -73.5695 |
| GOW Tech Shop | 2 | 40.670 | -73.9950 |
| Columbia Park | 2 | 40.697 | -74.0969 |
| Bike Mechanics at Riis Room A | 2 | 40.725 | -73.9747 |
| 8D OPS 01 | 2 | 40.663 | -73.9997 |
| Prototype Lab Motivate Headquarters | 1 | 40.657 | -74.0085 |
| Bike Mechanics at Riis Room B | 1 | 40.672 | -73.9971 |
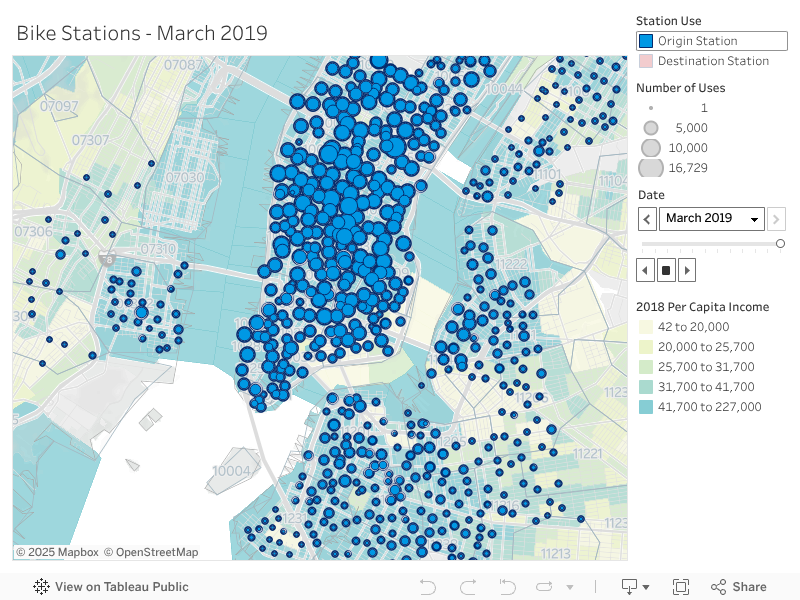
The primary determining factor for how heavily a station is used is the GDP per capita income of the station’s location. This can be seen in the figure below where darker block groups show higher GDP per capita income, and larger station markers show their level of use. Higher income areas are more likely to use Citi Bike.
Breakdowns
Usertypes
Citi Bike has two tiers of users: customers who pay for one and three day passes, and subscribers who pay an annual fee for unlimited bike use. The bulk of the user base are annual subscribers, who total anywhere from 85% to almost 96% depending on the month.

Gender
There are three categories for gender: male, female, and unknown. Most riders are male, which accounts for 65 - 75% of the user base (depending on the month), followed by female at 21 - 25%, and unknown at 3.5 - 11%.
Age and Trip Duration
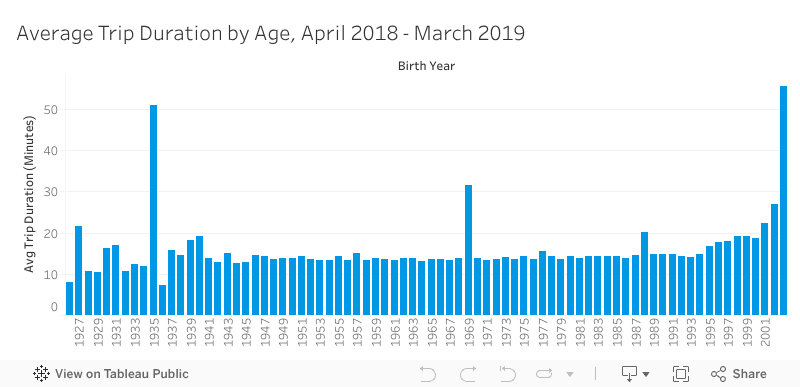
Overall average trip duration for all ages was 16.19 minutes. Average trip duration per age can be seen in the figure below. Generally, most average trip times per age are between 13 and 15 minutes. The younger riders, born in 1995 or later, tend to take slightly longer trips. There are few records for older riders, born 1936 and earlier, and as a result their average times vary greatly. There is an unusual spike at those born in 1969 that brings their average up to over half an hour (we’ll examine that more closely later).
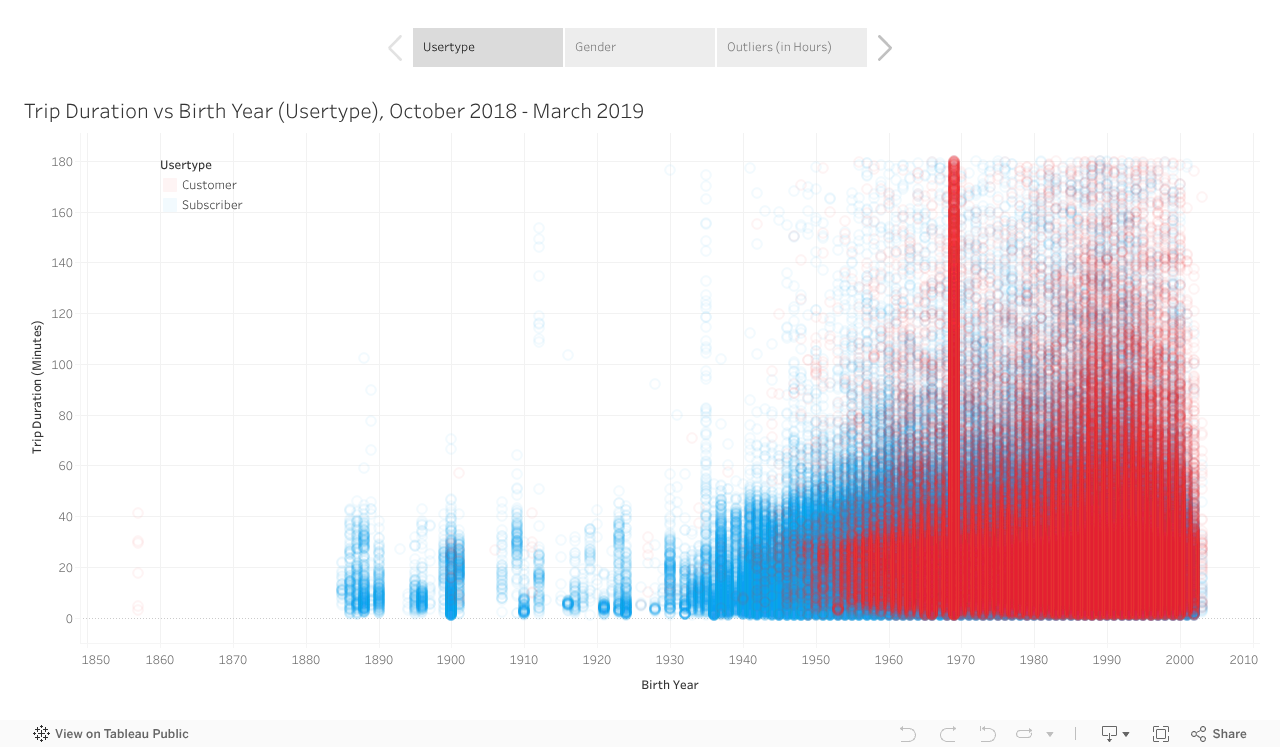
TThe following visual shows the spread of trip duration by age and usertype or gender, with a maximum trip time of three hours. Note that there’s a distinct spike at 1969 again. Citi Bike charges extra money for every 15 minutes beyond 45 minutes for subscribers and 30 minutes for customers, so it’s interesting to see such a large amount of records that go above that time limit. Curiously there are trips that last over 24 hours—even almost 900 hours! Citi Bike says that trip logs for bikes taken out for maintenance are removed from their public data. Apparently there have been many issues with bikes not docking correctly and being stolen, so these lengthy outliers may be such bikes. They can be seen on the third page of the figure.
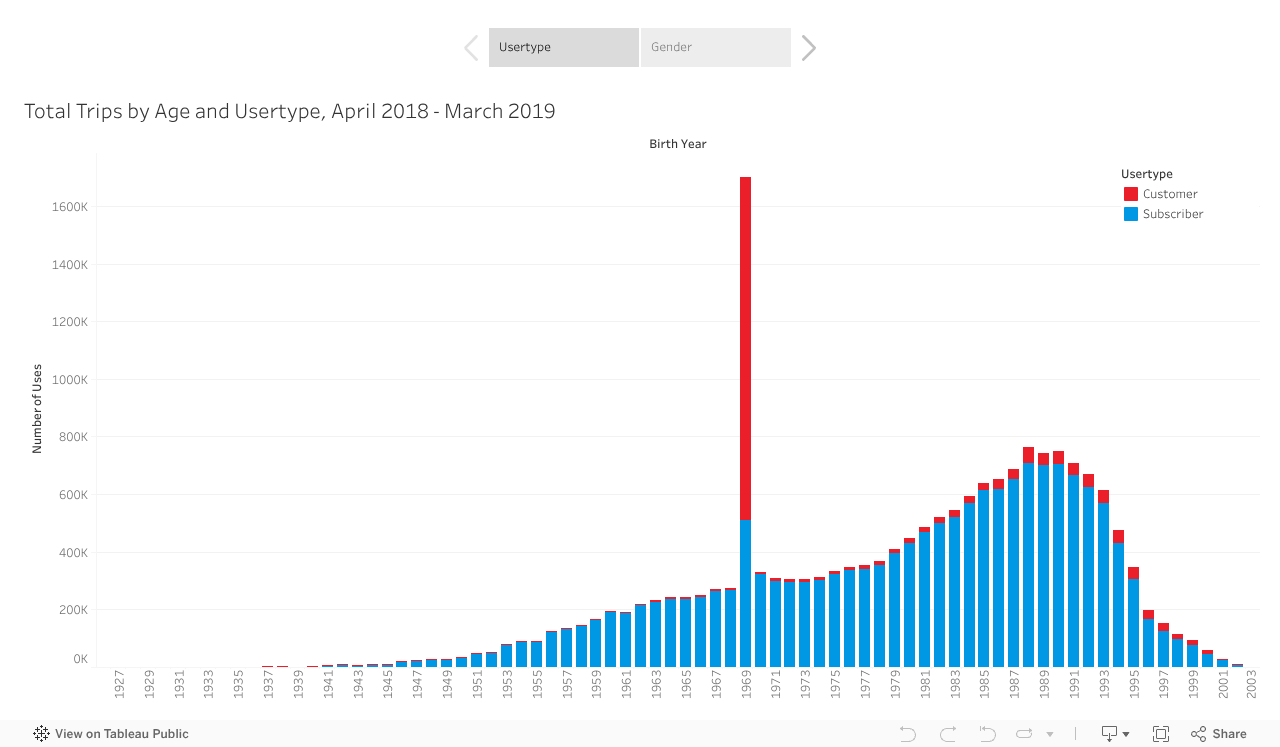
Born in 1969?
On display in the figure below is the immaturity of humans who sign up as customers. There probably isn’t an inordinate amount of 50-year-olds purchasing one and three day passes from Citi Bike. When we look at the gender of the users who say that they were born in 1969 it becomes quite clear that these are people who wish to remain anonymous as much as possible, and are having a little bit of fun with a Spartacus anonymity.
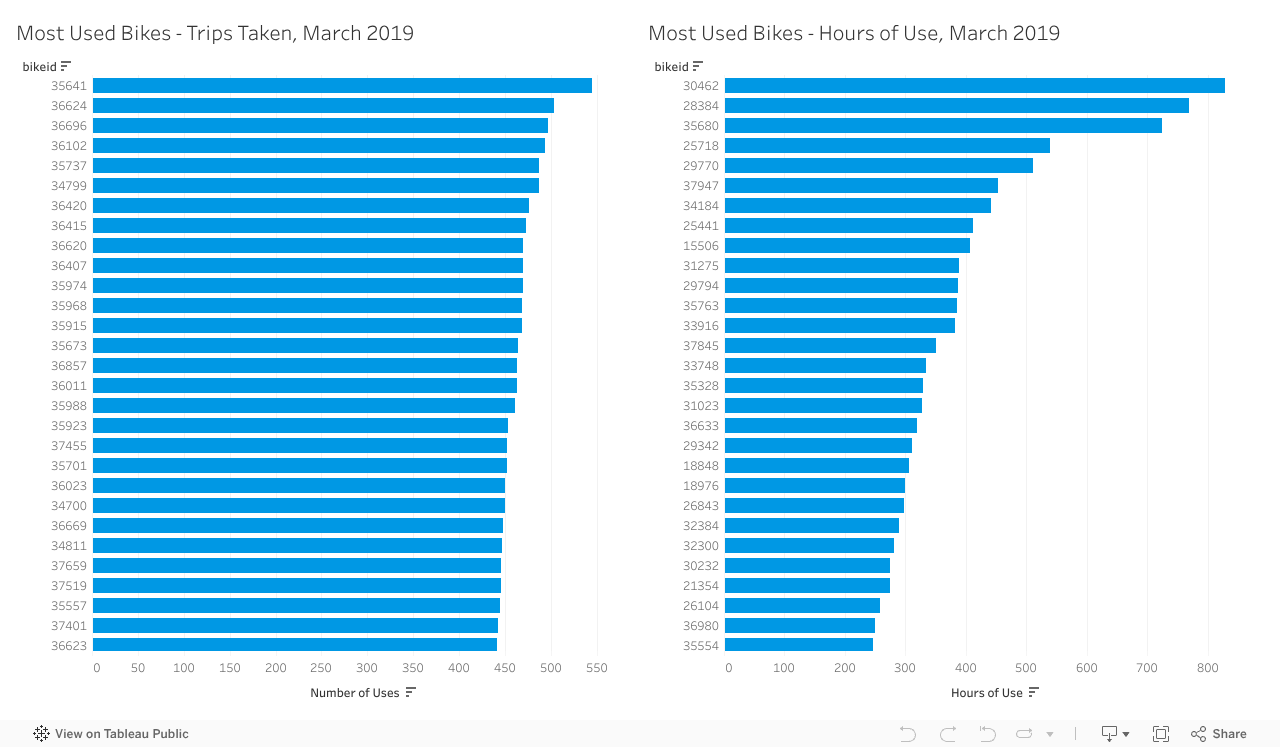
Individual Bike Use
The following figure shows the use of bikes for March 2019. Citi Bike inspects their bikes at least once every 45 days, but the bikes at the top of these lists could likely use another inspection sooner rather than later.